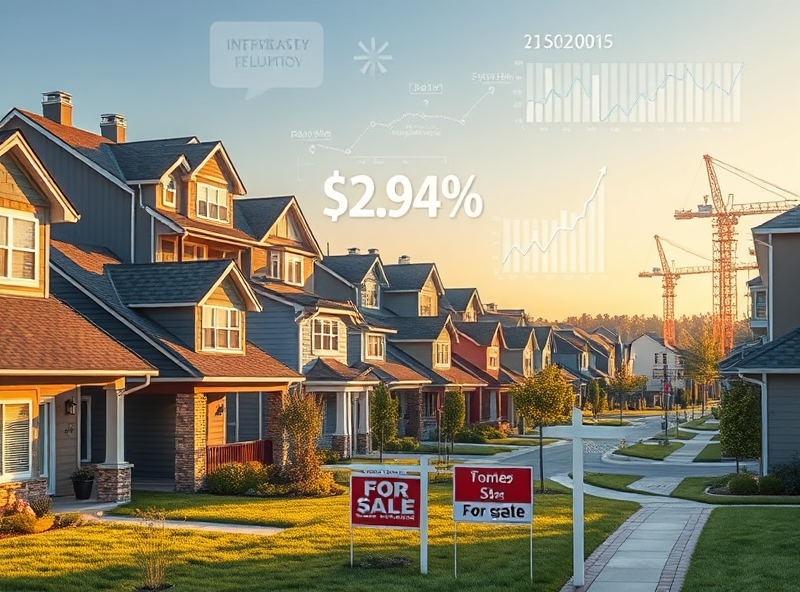
Economic Indicators Driving the U.S. Housing Market: What Homebuyers and Investors Need to Know

Understanding the Core Economic Indicators Shaping the U.S. Housing Market
While the U.S. housing market has always been sensitive to macroeconomic trends, the post-2025 landscape is revealing new dynamics. As a U.S.-based real estate blogger and investor, I’ve seen firsthand how nuanced these indicators have become. The Federal Reserve’s interest rate policy, inflation expectations, employment data, and consumer sentiment are no longer acting in isolation—they’re interacting in complex ways that demand deeper analysis.
For example, the Federal Reserve’s recent decision to hold the federal funds rate at 5.25% in early 2025 has had a cooling effect on mortgage demand. According to Federal Reserve data, 30-year fixed mortgage rates have hovered around 6.9%, making affordability a key concern for first-time buyers. However, investors are seeing opportunities in rental markets as homeownership becomes less accessible.
Meanwhile, the U.S. Bureau of Labor Statistics reports that the unemployment rate remains low at 3.8% as of March 2025, signaling a resilient labor market. This has helped stabilize housing demand in metropolitan areas like Austin, TX and Raleigh, NC, where tech and healthcare sectors continue to grow.
Inflation and Mortgage Rates: A Delicate Balance
Inflation has been a major driver of housing costs. The Consumer Price Index (CPI) rose 3.2% year-over-year in Q1 2025, according to the Bureau of Labor Statistics. While this is a decline from the 2022-2023 highs, it still pressures the Federal Reserve to maintain higher interest rates, which in turn keeps mortgage rates elevated.
Here’s a comparative table showing how inflation and mortgage rates have moved in tandem:
| Year | Inflation Rate (CPI) | 30-Year Mortgage Rate |
|---|---|---|
| 2023 | 5.0% | 7.1% |
| 2024 | 3.6% | 6.8% |
| 2025 (Q1) | 3.2% | 6.9% |
As a homeowner who refinanced in 2020 at 3.1%, I can attest to the financial advantage of locking in a low rate. Today’s buyers, however, must navigate a more expensive borrowing environment, making tools like adjustable-rate mortgages (ARMs) and buydown options more attractive.
Housing Supply Constraints and Regional Disparities
One of the most under-discussed yet critical indicators is housing supply. According to the National Association of Realtors (NAR), the U.S. is short by approximately 4.3 million housing units as of 2025. This shortage is particularly acute in high-growth states like Florida, Arizona, and Texas.
In Miami, for instance, home prices have risen 8.5% year-over-year, outpacing wage growth by nearly 3x. Builders are constrained by labor shortages and high material costs, despite efforts to streamline permitting processes. This creates a scenario where even moderate demand leads to significant price increases.
Investors should consider Build-to-Rent (BTR) models in these markets, which are gaining traction. Companies like Invitation Homes and American Homes 4 Rent are expanding their portfolios aggressively in these regions.
Consumer Sentiment and Behavioral Shifts
Beyond hard data, consumer psychology plays a growing role. The University of Michigan’s Consumer Sentiment Index rose to 82.4 in April 2025, the highest since 2021. However, sentiment is bifurcated: while older homeowners feel confident, younger buyers express frustration over affordability and inventory shortages.
In a recent Fannie Mae survey, 78% of Gen Z respondents said they expect to rent for the next five years, citing student debt and high down payments as primary barriers. This shift in behavior is reshaping demand patterns and influencing where developers focus their efforts.
As someone who mentors first-time buyers, I recommend exploring down payment assistance programs offered by state housing agencies. These often go underutilized but can make a significant difference in qualifying for a mortgage.
Expert Insight: What Economists Are Watching in 2025
Dr. Lawrence Yun, Chief Economist at the National Association of Realtors, recently stated, “We are entering a new normal where 6-7% mortgage rates may persist through 2026. Buyers and investors must recalibrate their expectations accordingly.” (Wayback Machine – NAR Newsroom)
Meanwhile, Moody’s Analytics warns of localized housing bubbles in markets like Boise, ID and Salt Lake City, UT, where price-to-income ratios have reached unsustainable levels. Investors should apply stress-testing scenarios to their portfolios, factoring in potential 10-15% price corrections in overheated areas.
One practical tool I use is the Housing Affordability Index (HAI), published monthly by the NAR. It helps gauge whether median-income families can afford median-priced homes. As of March 2025, the national HAI stands at 97.5—below the neutral threshold of 100, indicating declining affordability.
Conclusion: Navigating the Market with Data-Driven Confidence
The U.S. housing market in 2025 is shaped by a complex web of economic indicators, each influencing the other. Whether you’re a first-time buyer in Denver or a real estate investor in Charlotte, understanding these metrics is essential for making informed decisions. Stay updated, use reliable tools, and don’t hesitate to consult with local experts who understand your market’s unique dynamics.
Disclaimer
This blog post is for informational purposes only and does not constitute financial, investment, or legal advice. Always consult with a licensed professional before making any real estate or financial decisions. Data and statistics are accurate as of April 2025 and are subject to change.
About the Author
James M. Carter is a U.S.-based real estate investor, financial blogger, and former mortgage advisor with over 12 years of experience in the housing market. He holds a B.A. in Economics from the University of Michigan and regularly contributes to industry publications like HousingWire and Realtor Magazine.


답글 남기기